
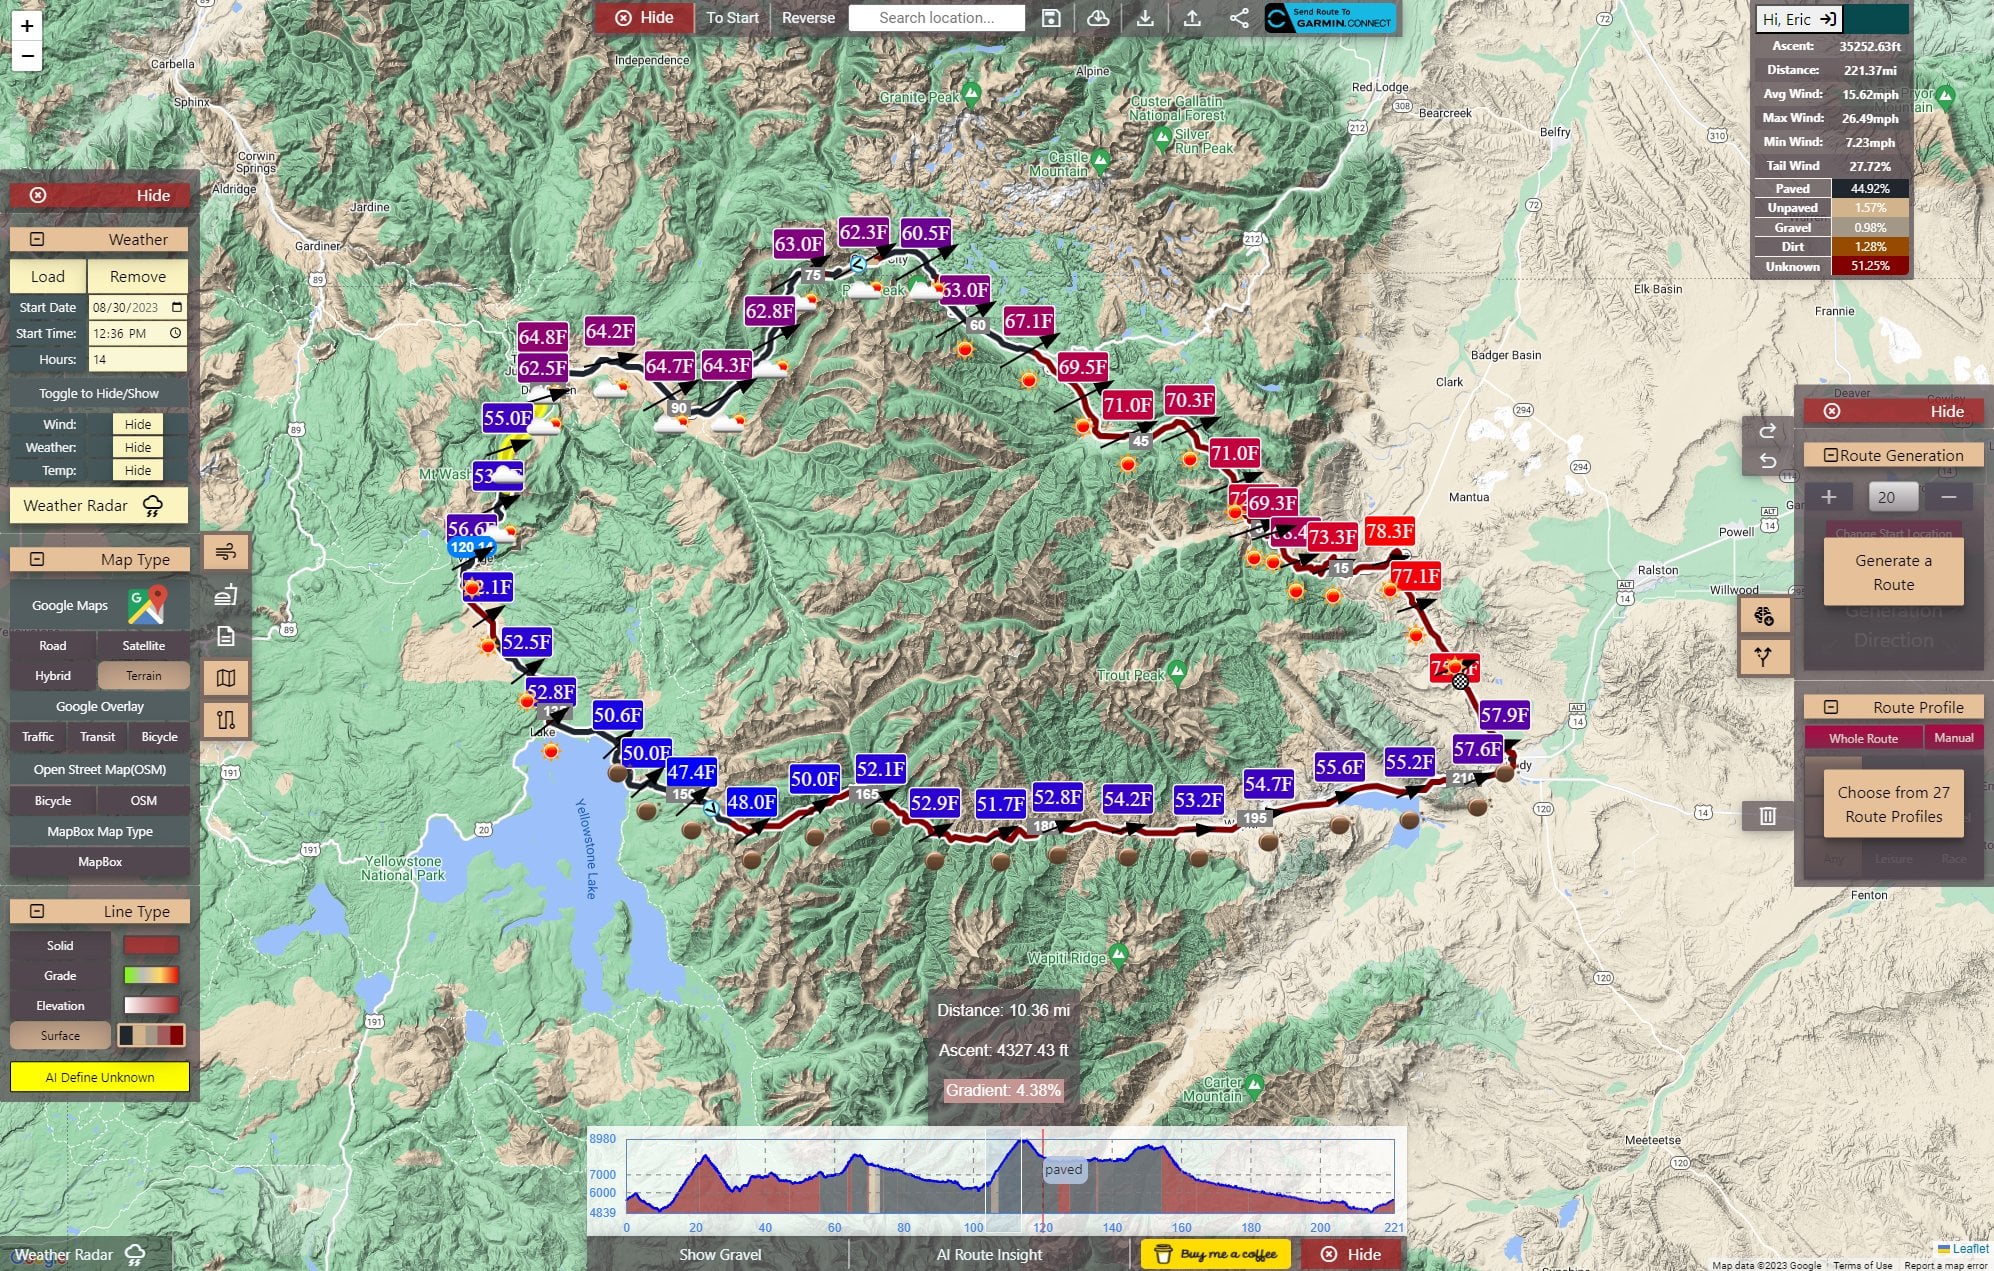
My roommates and I are back at it, we previously developed (and are constantly working on!) the 100% free cycling routing site [https://sherpa-map.com](https://sherpa-map.com) and received some amazing feedback over the past year from you guys after a couple of posts.
Our new addition is [https://sherpa-map.com/cycling-route-calculator.html](https://sherpa-map.com/cycling-route-calculator.html)! This is the culmination of so much time and effort, it is prototype numero uno.
This site lets anyone upload a route/race/etc. as a GPX file and then run a physics simulation with a ton of cycling-specific inputs to see how fast you might be! It takes into account surface type, and skill level, it even lets you pull weather data for the entire route, giving you weather data for race day and using it in the physics calculations!
​
[Demonstration of a simulation!](https://i.redd.it/h9uzl46n27wb1.gif)
I’ve even added some super cool tools like the ability to “paint” surface types onto the route for portions where you may know better (or it’s just “unknown”):
[Painting surfaces on](https://i.redd.it/g362ypy327wb1.gif)
​
Now, the options presented might be a bit overwhelming, and, I’m still working on adding documentation/tooltips and further information, so I made this YouTube video as a tutorial if you want a more in-depth explanation: [https://www.youtube.com/watch?v=NzOL7lX0p4o&feature=youtu.be](https://www.youtube.com/watch?v=NzOL7lX0p4o&feature=youtu.be)
However, trust me when I say I went deep into the weeds on this one. I have everything from modeled “sketchiness” values, causing the simulation to apply brakes at times, sit up a bit more when climbing, and become more aero into headwinds or on descents.
For a given route, I interpolate the points that make it up and make sure there’s at least 1 point every 25 meters, the physics calculations are simulated at each point utilizing speed from previous points. I cause the model to apply the brakes into sharp turns and accelerate out. I take the watt average you enter and redistribute it (keeping the same average) so more power is applied into hills, less into descents, more into headwinds, less with tailwinds, etc.
I’ve attempted to give thought to every last detail, but just in case I’m wrong, I’m working on adding an input for each factor in the model driving some of these data points with a nice explanation and a submission button for review, once that’s finished being implemented it will only grow more accurate!
I also intend on adding nutrition information to this, as I have soooooo much data, given weather, elevation, sun exposure, distance, humidity, bike setup, where you’ll be when, etc. I can easily give a breakdown of how much should be eaten when or how much water/electrolytes will be utilized.
So, at this time, I have a working prototype and thought people would love to use it, again, just like [https://sherpa-map.com](https://sherpa-map.com) it’s 100% free, even with all the cool weather details (I even calculate tailwind percentage, longest headwind, all sorts of fun stuff).
Oh, final note, the little cycling avatar that appears is going at 15x speed, I’m going to add an input for this at some point, also, it’s currently all metric, but I’ll add a conversion button soon to imperial, and yes, I will have beautiful graphs soon enough.
​
by firebird8541154
3 Comments
If anyone has thoughts/questions/feedback, I’m all ears 🙂
This looks amazing! I’m gonna pull some old ride data from my Garmin and see how it stacks up! This’ll be great to hold against Komoot as well. I find that I fall in between their performance levels at times, so it’s nice to have something that I can tweak.
Btw: Do you guys still get time to ride? 😂
WOW