
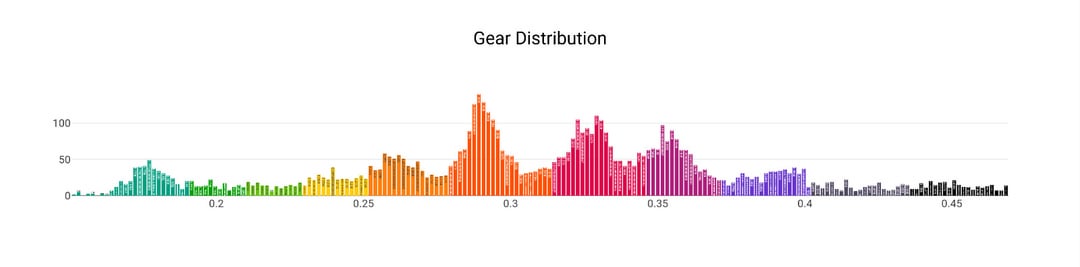
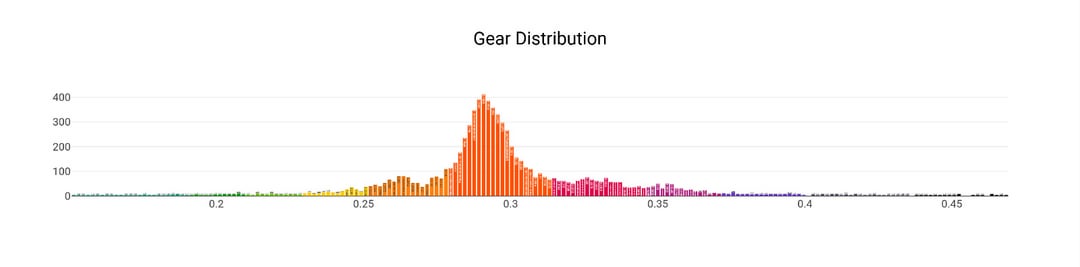
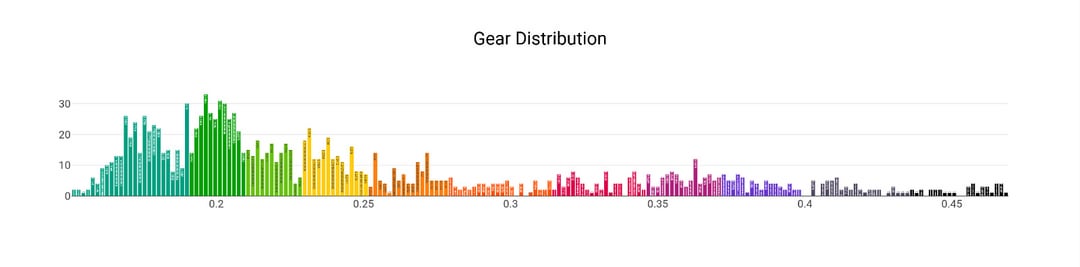
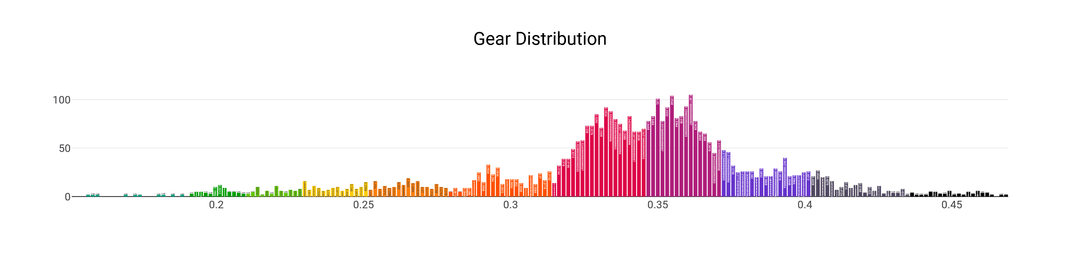
Using the Intervals.ICU javascript custom plot, i used cadence and speed data, together with gear ratio and wheel circumference data, to create a Gear usage distribution. I am honestly surprised by how good it works, especially for longer rides!
Does not require electronics shifters, only cadence and speed data.
Currently only plots accurately for one front chainring(im lazy 😅).
You can find it by searching for "gear estimator" in the custom charts.
You will probably need to modify the script a bit to suit your specific setup, if you want to use it.
by RIPEMD-320
1 Comment
Wow, that’s a neat viz! What’s the axes? Time [s] and gear ratio (rd teeth/fr teeth)? Do you filter out any coasting data? I’d love to give this a spin!